Minetosh online
Geology – Web-Apps – Learning German – and more ...

Minetosh online – Geology Web-Apps
MicaCalc

MicaCalc automatically calculates muscovite compositions from microprobe analyses.
The results are presented in tables and in various diagrams (Phengite solid solution series, Mu-Pg-Ce diagram, A'KF diagram, AFM (Ms and Kf) diagram. For further details see below.

MicaCalc – Muscovite: Composition and classification
Using microprobe analyses, this program can be used to automatically calculate muscovite compositions based on 22 oxygen atoms. The oxides, the cations, the lattice site occupancies, the end members Margarite (CaAl₂)[Si₂Al₂O₁₀](OH)₂), Paragonite (NaAl₂)[Si₃AlO₁₀](OH)₂), Celadonite (K(Mg, Fe²⁺)(Fe³⁺, Al)[Si₄O₁₀](OH)₂) and Muscovite (KAl₂[AlSi₃O₁₀](OH)₂), as well as the values for divalent and trivalent iron are calculated (total iron, Fe²⁺, Fe³⁺).
The micas are classified using the Muscovite-phengite-celadonite diagram, the A'KF diagram (A' = [Al₂O₃+Fe₂0₃]-[Na₂O+K₂O+CaO], K = K₂O, F = Fe0+MgO+MnO) and the AFM (Ms and Kf) diagrams.
Furthermore, the micas are presented in a diagram in which the Si content per formula unit (Si/f.u.) is plotted against the aluminum content per formula unit (Al/f.u.) (based on 11 oxygen atoms). The straight line shown in this diagram represents the Phengite solid solution series. The Si content of muscovite can provide information about the physical conditions during metamorphism (“Phengit Barometer”;
see literature).
You can enter the values individually in the table below or use the input fields. Here you enter for up to 5 micas the values (oxides) as rows separated by single spaces (see placeholders; 200 characters max.). Note the order of the elements in the table: Na Mg Al Si K Ca Ti Mn Fe (total Fe as FeO) H₂O Ba Cr! Additionally, the sample designation must come first. You can use the period or the comma as a decimal separator.
Your micas
You can also enter your data (oxides) here (into the light-blue fields).
| Name | |||||
| Oxides | Oxides | Oxides | Oxides | Oxides | |
| Na2O | |||||
| MgO | |||||
| Al2O3 | |||||
| SiO2 | |||||
| K2O | |||||
| CaO | |||||
| TiO2 | |||||
| MnO | |||||
| FeO | |||||
| H2O | |||||
| BaO | |||||
| Cr2O3 | |||||
| Total | |||||
| Temperature selection* | |||||
| Temp. [°C] | |||||
* Here you can enter for each mica a temperature (from 500°C to 1100°C max.). This value is used to make a rough pressure estimate with the Phengite barometer. The results are shown in a diagram under "Show Phengite Barometer".
Constants and intermediate results
| Oxides [wt.-%] | Mol wt. (AW) | Mol-Prop. | Element | Wt.-% | Atom-Prop. | Oxygen | Cations (O=22) | |
|---|---|---|---|---|---|---|---|---|
| Mica 1 | ||||||||
| SiO2 | Si | |||||||
| TiO2 | Ti | |||||||
| Al2O3 | Al | |||||||
| Cr2O3 | Cr | |||||||
| MgO | Mg | |||||||
| CaO | Ca | |||||||
| MnO | Mn | |||||||
| FeO | Fe | |||||||
| BaO | Ba | |||||||
| Na2O | Na | |||||||
| K2O | K | |||||||
| Total* | *without Water | |||||||
| Mica 2 | ||||||||
| SiO2 | Si | |||||||
| TiO2 | Ti | |||||||
| Al2O3 | Al | |||||||
| Cr2O3 | Cr | |||||||
| MgO | Mg | |||||||
| CaO | Ca | |||||||
| MnO | Mn | |||||||
| FeO | Fe | |||||||
| BaO | Ba | |||||||
| Na2O | Na | |||||||
| K2O | K | |||||||
| Total* | *without Water | |||||||
| Mica 3 | ||||||||
| SiO2 | Si | |||||||
| TiO2 | Ti | |||||||
| Al2O3 | Al | |||||||
| Cr2O3 | Cr | |||||||
| MgO | Mg | |||||||
| CaO | Ca | |||||||
| MnO | Mn | |||||||
| FeO | Fe | |||||||
| BaO | Ba | |||||||
| Na2O | Na | |||||||
| K2O | K | |||||||
| Total* | *without Water | |||||||
| Mica 4 | ||||||||
| SiO2 | Si | |||||||
| TiO2 | Ti | |||||||
| Al2O3 | Al | |||||||
| Cr2O3 | Cr | |||||||
| MgO | Mg | |||||||
| CaO | Ca | |||||||
| MnO | Mn | |||||||
| FeO | Fe | |||||||
| BaO | Ba | |||||||
| Na2O | Na | |||||||
| K2O | K | |||||||
| Total* | *without Water | |||||||
| Mica 5 | ||||||||
| SiO2 | Si | |||||||
| TiO2 | Ti | |||||||
| Al2O3 | Al | |||||||
| Cr2O3 | Cr | |||||||
| MgO | Mg | |||||||
| CaO | Ca | |||||||
| MnO | Mn | |||||||
| FeO | Fe | |||||||
| BaO | Ba | |||||||
| Na2O | Na | |||||||
| K2O | K | |||||||
| Total* | *without Water | |||||||
| Mica 1 | Mica 2 | Mica 3 | Mica 4 | Mica 5 | |
|---|---|---|---|---|---|
| Grid occupation | |||||
| Tetrahedron | |||||
| Tetrahedral Al | |||||
| Octahedral Al | |||||
| Octahedron | |||||
| Interlayer | |||||
| Total | |||||
Check total
 Compares the sum of the cations (O=22) with the sum of the lattice occupation. These should be equal, so the difference should be 0. Minor deviations can be attributed to rounding errors. Otherwise there may be an analysis error.
|
|||||
| The ratio FeO/(FeO+MgO) | |||||
| FeO/(FeO+MgO) | |||||
| A´KF | |||||
| A´ | |||||
| K | |||||
| F | |||||
| Total | |||||
| A´KF (*100) | |||||
| A´ | |||||
| K | |||||
| F | |||||
| Total | |||||
| AFM (Ms) | |||||
| A (Ms) | |||||
| F | |||||
| M | |||||
| AFM (Kf) | |||||
| A (Kf) | |||||
| F | |||||
| M | |||||
Results
Muscovite (22 oxygens)
| Mica 1 | Mica 2 | Mica 3 | Mica 4 | Mica 5 | |
|---|---|---|---|---|---|
| SiO2 | |||||
| TiO2 | |||||
| Al2O3 | |||||
| Cr2O3 | |||||
| MgO | |||||
| CaO | |||||
| MnO | |||||
| FeO | |||||
| BaO | |||||
| Na2O | |||||
| K2O | |||||
| H2O | |||||
| Total | |||||
| Cations | |||||
| Si | |||||
| Ti | |||||
| Al | |||||
| Cr | |||||
| Mg | |||||
| Ca | |||||
| Mn | |||||
| Fe | |||||
| Ba | |||||
| Na | |||||
| K | |||||
| Total | |||||
| The ratio FeO/(FeO+MgO): X(Fe) | |||||
| X(Fe) | |||||
| Grid occupation | |||||
| Si | |||||
| AlIV | |||||
| Tetrahedron | |||||
| AlVI | |||||
| Cr | |||||
| Ti | |||||
| Fetotal (Fe²⁺) | |||||
| Mn | |||||
| Mg | |||||
| Octahedron | |||||
| Ba | |||||
| Ca | |||||
| Na | |||||
| K | |||||
| Interlayer | |||||
| Total | |||||
| End-members | |||||
| Margarite
Margarite: (CaAl₂)[Si₂Al₂O₁₀](OH)₂)
|
|||||
| Paragonite
Paragonite: (NaAl₂)[Si₃AlO₁₀](OH)₂)
|
|||||
| Celadonite
Celadonite: (K(Mg, Fe²⁺)(Fe³⁺, Al)[Si₄O₁₀](OH)₂)
|
|||||
| Muscovite
Muscovite (KAl₂[AlSi₃O₁₀](OH)₂)
|
|||||
| Total | |||||
| Phengite component in Muscovite
The term phengite is generally used for muscovites whose Si/Al ratio is greater than 3:1 and in which the increase in Si is associated with a substitution of Mg²⁺ and Fe²⁺ for Al on the octahedrally coordinated lattice sites (Deer et al., 1992).
|
|||||
| Phengite | |||||
| Muscovite | |||||
| Total | |||||
| The Phengite-Celadonite-Muscovite diagram | |||||
| Paragonite (Pa) | |||||
| Celadonite (Ce) | |||||
| Muscovite (Mu) | |||||
| Total | |||||
| Fetot., Fe²⁺, Fe³⁺ | |||||
| Fetot. | |||||
| Fe²⁺ | |||||
| Fe³⁺ | |||||
| The A'KF diagram | |||||
| A' | |||||
| K | |||||
| F | |||||
| Total | |||||
| The AFM(Ms) diagram | |||||
| A (Ms) | |||||
| F | |||||
| M | |||||
| The AFM(Kf) diagram | |||||
| A (Kf) | |||||
| F | |||||
| M | |||||
| Total | |||||
| "Phengite barometer" | |||||
| Al/f.u. (11 O) | |||||
| Si/f.u. (11 O) | |||||
| Additional values [pfu] | |||||
| K+Na+Ca (22 O) | |||||
| Ti (11 O) | |||||
| Fe+Mg (22 O) | |||||
| Na/(Na+K) (22 O) | |||||
| Na/(Na+K) (11 O) | |||||
| Mean values (Mica 1–5) | |||||
| Ø Al (11 O) | |||||
| Ø Si (11 O) | |||||
| Min. Si (11 O) | |||||
| Max. Si (11 O) | |||||
| Ø Ti (22 O) | |||||
| Ø Si (22 O) | |||||
| Min. Ti (22 O) | |||||
| Max. Ti (22 O) | |||||
The Paragonite-Celadonite-Muscovite diagram

Classification of white micas using the Paragonite-Celadonite-Muscovite diagram
Captions
|
• |
Mica 1 |
|
• |
Mica 2 |
|
• |
Mica 3 |
|
• |
Mica 4 |
|
• |
Mica 5 |
|
Top corner |
Paragonite |
|
Right corner |
Celadonite |
|
Left corner |
Muscovite |
"Phengite Barometer"


The white micas in the Si/f.u. vs. Al/f.u. diagram. The straight line shown in this diagram represents the Phengite solid solution series between Muscovite and Celadonite. Higher Si-contents may represent higher formation pressures (see references at bottom of page).

The Si content of the muscovites plotted against temperature. The lines are isobars. The pressure information is in GPa (after Hermann & Spandler, 2008).
Captions
|
• |
Mica 1 |
|
• |
Mica 2 |
|
• |
Mica 3 |
|
• |
Mica 4 |
|
• |
Mica 5 |

Pressure-temperature diagram with the isopleths for the Si content per formula unit (Si/f.u.) of the phengites (normalized to 11 oxygen atoms) in the limiting paragenesis with potassium feldspar, phlogopite and quartz. The dashed line shows the stability curve for phengite with 3.3 Si/f.u. according to Velde (1965). The continuous curve at high temperatures marks the upper stability limit of paragenesis. According to Massonne & Schreyer (1987; Fig. 3).
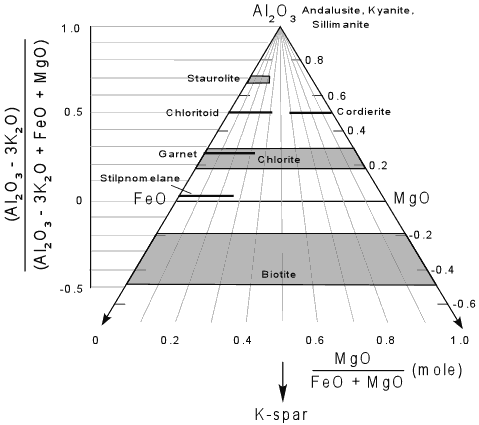
The A'KF diagram

The Micas shown in the A'KF diagram. For infos see captions below. After Ehlers & Blatt (1982).
Captions
|
• |
Mica 1 |
|
• |
Mica 2 |
|
• |
Mica 3 |
|
• |
Mica 4 |
|
• |
Mica 5 |
|
Bottom corner |
F = Fe0+MgO+MnO |
|
Red dot bottom corner |
Antophyllite, Opx |
|
Dark green field |
Chlorite |
|
White dot in dark green field |
Almandine |
|
Top right corner |
K = K₂O |
|
Purple dot top right corner |
K-feldspar |
|
Red dot at end of phengite line |
Muscovite |
|
Top left corner |
A' = (Al₂O₃+Fe₂0₃)-(Na₂O+K₂O+CaO) |
|
Green dot top left corner |
Kyanite, Andalusite, Sillimanite |
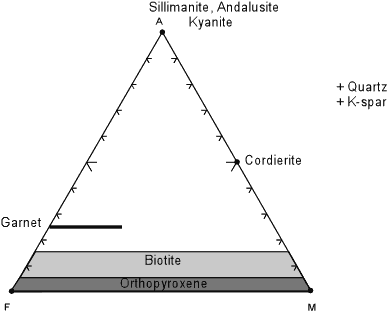
The AFM(Ms) diagram
The micas shown in the AFM(Ms) diagram (Top: A; Right: M; Left: F). After Nelson, S.A. (2011). To download the chart (MicaCalc_AFM(Ms).svg) and see more options, hover your mouse over the image.
Captions
|
• |
Mica 1 |
|
• |
Mica 2 |
|
• |
Mica 3 |
|
• |
Mica 4 |
|
• |
Mica 5 |
|
Between the red lines |
Biotite |
|
Between the green lines |
Chlorite |
|
The AFM(Ms) diagram The AFM(Ms) diagram. From Nelson, S.A. (2011). |
|
The AFM(Kf) diagram
.svg)
The Micas shown in the AFM(Kf) diagram. For infos see below. After Nelson, S.A. (2011).
Captions
|
• |
Mica 1 |
|
• |
Mica 2 |
|
• |
Mica 3 |
|
• |
Mica 4 |
|
• |
Mica 5 |
|
The AFM(Kf) diagram The AFM(Kf) diagram. From Nelson, S.A. (2011). |
|
Download data
Current date
Enter a title
Sample number, etc.
Download data file (*.csv)
Literature
A small, not very current selection. There are also newer publications on this topic on the Internet (e.g.).
- Deer, W.A., Howie, R.A. & Zussman, J. (1992): An introduction to the rock-forming minerals. – Longman Scientific & Technical, Harlow, 2nd edition 1992: 696 p.
- Ehlers, E.G. and Blatt, H. (1982): Petrology: Igneous, Sedimentary and Metamorphic. W. H. Freeman, New York, 732 p.
- Guidotti, C.V. (1984): Micas in metamorphic rocks. - In: Bailey, S.W. (Edt.): Reviews in mineralogy, Volume 13: Micas. - Mineralogical Society of America, Blacksburg, Virginia, 1984: 584 p.
- Guidotti, C.V. & Sassi, F.P. (1976): Muscovite as a petrogenetic indicator mineral in pelitic schists. - N. Jb. Miner. Abh., 127, 2: 97-142.
- Hermann, J. & Spandler, C. (2008): Sediment Melts at Sub-arc Depths: an Experimental Study. Journal of Petrology. 49. 10.1093/petrology/egm073.
- Hewitt, D.A. & Wones, D.R. (1984): Experimental phase relations of the white micas. - In: Bailey, S.W. (Edt.): Reviews in mineralogy, Volume 13: Micas. - Mineralogical Society of America, Blacksburg, Virginia, 1984: 584 p.
- Kemnitz, H., Gottesmann, B. & Naumann, R. (1994): Detrital micas from Upper Brioverian greywackes of Lusatia - Chemistry and first interpretation. - Zbl. Geol. Paläont. Teil I, 1992, 7/8: 837-846.
- Massonne, H.J. (1981): Phengite: Eine experimentelle Untersuchung ihres Druck-Temperatur-Verhaltens im System K2O-MgO-Al2O3-SiO2-H2O. - Dissertation (unveröffentlicht) Univ. Bochum.
- Massonne, H.J. & Schreyer, W. (1987): Phengite barometry based on the limiting assemblage K-feldspar, phlogopite and quartz. - Contrib. Mineral. Petrol (1987) 96: 212-224.
- Matthes S. (1987): Mineralogie – Eine Einführung in die spezielle Mineralogie, Petrologie und Lagerstättenkunde. – Springer-Verlag, Berlin, Heidelberg, 1987: 444 p.
- Nelson, S.A. (2011): Triangular Plots in Metamorphic Petrology – EENS 2120; Tulane University: PDF EENS 2120.
- Schäfer, J. (1996): Mikrosondenuntersuchungen an Geröllen und detritischen Mineralen im Flysch des Saxothuringikums: Ein Beitrag zur Exhumierungsgeschichte des Liefergebietes. – Inaugural dissertation to obtain a doctorate in natural sciences from the Justus Liebig University in Giessen (Department of Geosciences and Geography), Giessen, March 1996; 176 p.; German with English and French summaries.
- Schäfer J. (1997): Rapid exhumation of medium to high-pressure metamorphic rocks at the Saxothuringian – Moldanubian boundary: Evidence from detrital white micas in Saxothuringian synorogenic sediments (E-Variscides, Germany). – Neues Jahrbuch für Geologie und Paläontologie Abh., 206: 343-364; Stuttgart.
- Speer, J.A. (1984): Micas in igneous rocks. - In: Bailey, S.W. (Edt.): Reviews in mineralogy, Volume 13: Micas. - Mineralogical Society of America, Blacksburg, Virginia, 1984: 584 p.
- Velde, B. (1965): Phengite micas: Synthesis, stability, and natural occurrence. - Am. J. Sci., 263: 886-913.
- Velde, B. (1967): Si+4 content of natural phengites. - Contrib. Mineral. and Petrol., 14: 250-258.
- Wybrecht, E., Duplay, Piqué, A. & Weber, F. (1985): Mineralogical and chemical evolution of white micas and chlorites, from diagenesis to low-grade metamorphism; data from various size fractions of greywackes (Middle Cambrian, Morocco). - Mineralogical Magazine, 49: 401-411.